Balanced Scorecard & Linked Metrics Portfolio
Balanced Scorecard & Linked Metrics Portfolio Work Together
Drs. Robert S. Kaplan and David P. Norton's Balanced Scorecard revolutionized the way CEO's thought about measuring the corporation as a whole using a common framework. While many companies have adapted their practices from the written rule, the teachings of the Kaplan's scorecard underpin many principles of corporate measurement today. Few corporate frameworks can cite ongoing annual conferences for two decades.
While legitimately covering an amazing 90% of resources at most companies, the strength of the Balanced Scorecard is for transaction-processing functions. GGI is a proponent of systematic measurement, and the Balanced Scorecard is hard to rival. The "Scorecard's roots" are deep, with experience building since the early 1980s.
Linked Metrics Portfolio Milestones
The Linked Metrics Portfolio® was conceived in 2002. After working with Spider Diagrams, Fishbone Diagrams, Scorecards of several denominations, and listening to R&D professionals lament the miss of 80% of the R&D Spending for project-based functions, it was clear that something better was possible for the innovation, research and development, product creation, engineering, and product development business organizations.
Including client work (not shown) and our Metrics Summits ongoing since 2005, the Linked Metrics Portfolio® is part of practice at numerous companies.
In 2007, the USPTO awarded GGI a Trademark for our Linked Metrics Portfolio®.
• • • • • • • • • • • • • • • •
GGI has not made an effort to splash the Linked Metrics Portfolio® across public media since its inception in 2002. If you wish to link up to five layers of your organization together yielding a set of excutive level overall performance metrics for all of R&D as a whole, please consider its logic.
Linked Metrics Portfolio® Description
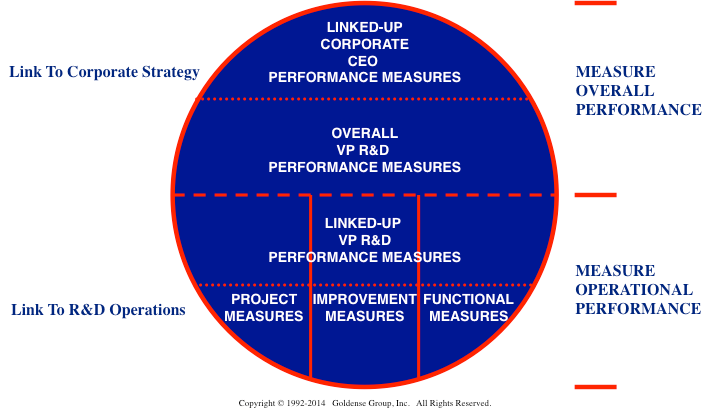
The approach gets at projects, integrates the engines of innovation which are the people, provides for rolling up metrics from lower levels to become a representative aggregate measure, and puts VPs on the line for metrics that can only be calculated at their level. This set of dashboards are then synthesized into a handful of metrics for the CEO for all of R&D and Product Development, independently or together. Output, productivity, and performance metrics are all within the logic of the Linked Metrics Portfolio®.
The CEO-level handful set of measures R&D-Product Development output, performance, and productivity. Whether or not your company is a Balanced Scorecard company or not, the Linked Metrics Portfolio® will generate a useful set of measures for all innovation functions that realize their results through projects and programs.
Linked Metrics Portfolio® Metrics Summit
If we may interest you further, please visit GGI's Metrics Summit Description page or our Metrics Summit Home Page. One concludes GGI Metrics Summits with a working portfolio of metrics, consisting of typically 28-48 metrics that together measure projects, functions, improvement efforts, and overall aggregate performance and productivity of innovation functions whose primary spending and output is based on projects. Professionals from R&D, Advanced Development, Product Development, and project-based organizations might consider the Linked Metrics Portfolio®.
Finally, our Summits are underpinned by our primary research of industry. Periodic studies have been done across North America since 1998. GGI was founded in 1986.
• • • • • • • • • • • • • • • •
Considerations For A "Balanced Scorecard Company"
If you are from a Balanced Scorecard company, often the required corporate performance metrics framework, the Linked Metrics Portfolio® will integrate well while also addressing the aggregate performance of the 80% of R&D Spend that is projects and programs. An informal history of the Balanced Scorecard describes how the two approaches work together.